CMI researchers at Idaho National Laboratory collaborated with CMI Team member OLI Systems in the research that led to this highlight
Achievements
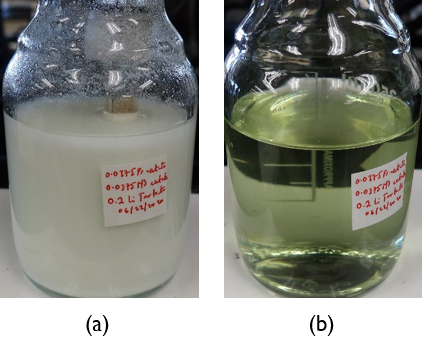
Collaboration with OLI has allowed, through production of phase diagrams, an increase in REE concentration which was previously hindered by precipitation of REEs in solution (Figure 1). The diagram in Figure 2 shows a regions in the upper right corner where high REE concentrations can be achieved by increasing the solution pH.
Significance and impact
- Increase of REE concentration in lithium tartrate solution allows experiments to be carried out at higher concentrations
- Increase in REE concentration may allow process conditions (throughput) necessary for industrial application
Details and next steps
- Prepare concentrated solutions of REEs in lithium tartrate
- Run experiments with higher concentrations of REEs to observe how concertation affects alloy formation rates and separation factors
