CMI researchers from Missouri S&T conducted the activity for this highlight
Innovation
Flowsheet development for the selective separation of PGMs, precious metals, and critical elements from unconventional sources (Se residue).
Achievement
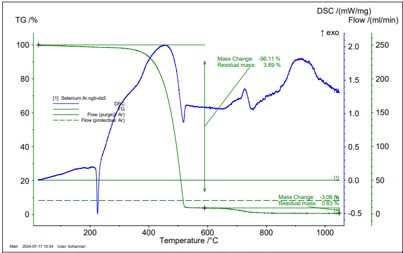
- Approximately 99% of the mass is anticipated to vaporize by vacuum distillation of Se residue - that originally has 90% of Se , 3% of Te, & 0.24% of PGMs, and precious metals - according to TGA results . Most mass was loss (~ 95%) a temperatures above 550⁰ C.
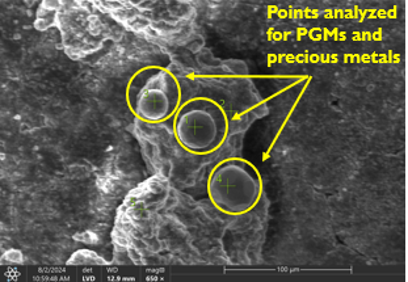
- TGA residue was enriched in PGMs and precious metals as indicated by SEM analysis. Se and Te were not detected in residue.
Significance and Impact
- Increase domestic production of PGMs, supply chain diversification
- Community benefits
Hub Target Addressed
Improving efficiency of PGM production from domestic sources.
